- fix bugs in visibility bounds
- create a visualization tool (light tree, light cuts & precalculated visibility)
- calculate optimal visibility bounds (i.e. perfect visibility estimation in bounds)
The general settings used where:
- samples/pixel: 1
- resolution: 640x480
- #light sources: 3000 (allows calculating a reference solution in an acceptable time frame)
- maximum cut size: 1000
 Because only an upper bound is used, there is no improvement (i.e. 0% less cut size) but most of the occluded regions have a reduction of about 50% or more. The grid that was used for the visibility calculation is also clearly visible. The next image shows the relative distance from the optimal solution (i.e. (optimal cut - estimate cut)/optimal cut):
 Here it is clearly visible that some occlusion cannot be easily detected by using a grid subdivision: the upper part of the back of the chairs is occluded by the chair itself. The occluding geometry in this case is located at a very low angle w.r.t. the occluded points. But the cells used to calculate occlusion extend to a significant distance away from the chair and is only partly occluded. This could be solved by using smaller cells or taking geometric orientation of the surfaces into account for calculating visibility (ex. start the rays from a plane aligned to the local geometry instead of from within a fixed bounding box).
Over the past few weeks I also implemented (after suggestion by my counselor) a tool that allows interactive inspection of: the light tree, the light cuts used for each points and the visibility bounds precalculated for each cell. These are all visualized by drawing the scene and some bounding boxes (representing the data) with opengl. For the light tree all bounding boxes at a specific level of the hierarchy are shown. The following scene shows the 5th (out of 15) level of the light hierarchy calculated for the conference scene:
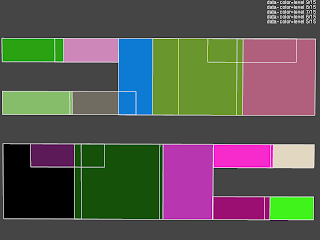
It is a top view of the 4 rows of light sources on the ceiling where each cluster is colored in a different color and an indication of the edges of these clusters. It is immediately apparent that an improvement is possible: there is a significant overlap between the clusters and the cluster sizes are quiet dissimilar even though all point light sources have the same intensity and orientation and are evenly distributed over the light sources. The cause is most likely the greedy bottom up approach used to cluster light sources which will produce the best cluster low in the hierarchy and possibly worse (due to its greedy nature) near the top. Intuitively this is not optimal as the lower part of the tree is unimportant for most light cuts and the upper part is used by all light clusters.
The next picture shows the visualization of the precalculated visibility for the selected cell under the chair (indicated by a red box):
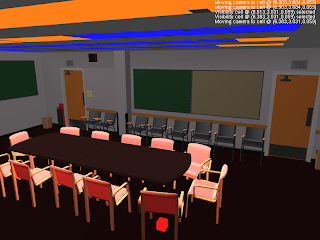
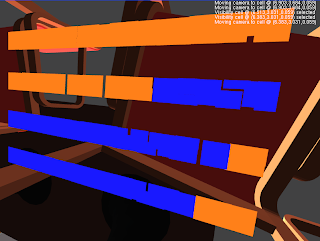
The blue colored light clusters are detected as occluded and the orange onces as potentially unoccluded. The quality of this specific bound is better visible when these clusters are rendered from the perspective of the cell (disabling the depth test on the visibility data) as seen in the following image:
Finally the light cut calculated, on the same position as the previous image, using the lightcuts algorithm and the extension with an upper bound on visibility is shown in the following 2 images (each cluster has an individual color):
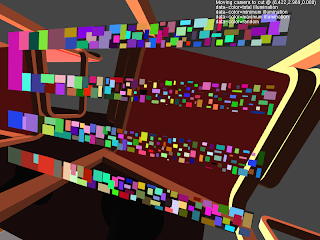
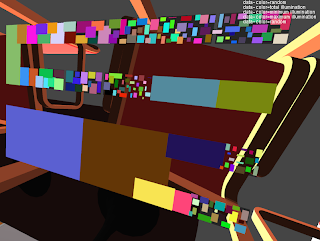
A clear reduction in the number of light clusters used is visible (from about 550 to 200).
1 comment:
Oi, achei seu blog pelo google está bem interessante gostei desse post. Gostaria de falar sobre o CresceNet. O CresceNet é um provedor de internet discada que remunera seus usuários pelo tempo conectado. Exatamente isso que você leu, estão pagando para você conectar. O provedor paga 20 centavos por hora de conexão discada com ligação local para mais de 2100 cidades do Brasil. O CresceNet tem um acelerador de conexão, que deixa sua conexão até 10 vezes mais rápida. Quem utiliza banda larga pode lucrar também, basta se cadastrar no CresceNet e quando for dormir conectar por discada, é possível pagar a ADSL só com o dinheiro da discada. Nos horários de minuto único o gasto com telefone é mínimo e a remuneração do CresceNet generosa. Se você quiser linkar o Cresce.Net(www.provedorcrescenet.com) no seu blog eu ficaria agradecido, até mais e sucesso. If is possible add the CresceNet(www.provedorcrescenet.com) in your blogroll, I thank. Good bye friend.
Post a Comment